 Display view/reaction/follower increases on the dashboard page
#13299

Hopefully, this is the right place for this.
This feature request was sparked by a comment on one of my posts. I've recently completed implementing my own Dev.to analytics dashboard by creating a store of historical data in Azure Cosmos DB. My take: https://devto-analytics.wallis.dev/
Overview stats
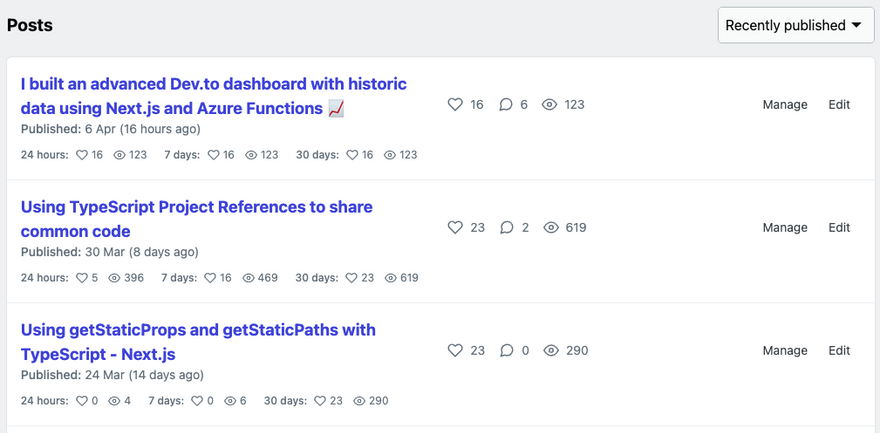
It'd be great if Dev.to users were able to see stat increases in the overview stats on the dashboard page. Such as:
- Page view / reaction increase over the past 24 hours, 7 days and 30 days
- Comment increase over the past 7 days and 30 days
- Follower increase over the past 24 hours, 7 days and 30 days
- Number of posts published in the past 30 days / current weekly streak (which would partially resolve https://github.com/forem/forem/issues/9210)
Individual post stats
Additionally, it would be good to see the view, reaction and comment increases for each post again over a 24 hour, 7 days and 30 day period.
I'm aware that we're able to see stats for an individual post using the stats option that has been added next to edit and manage - this is a great addition btw. However, IMO adding it to the main dashboard screen will increase the analytics usability as users will able to see the changes at a glance.
Other
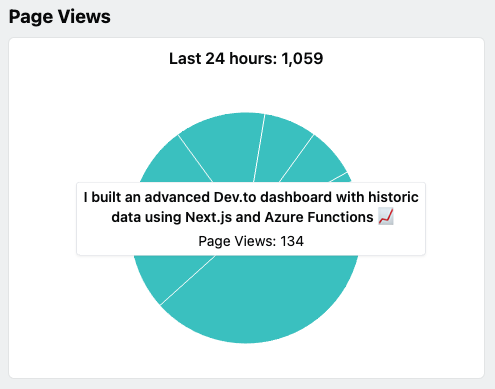
This is sort of an aside (might be another issue entirely). If a view/reaction increase breakdown could be added to the https://dev.to/dashboard/analytics page that would help users understand what posts have been most popular for a given day.
I attempted to implement this feature on my Dev.to analytics dashboard but it became a bit messy when there are lots of posts: https://devto-analytics.wallis.dev/graphs/breakdown
Thanks for taking the time to read this request.
This is a feature request from a DEV user James who implemented their own dev.to analytics dashboard.
I'll be adding the details they originally posted on GitHub so we can further discuss them here.
Overview stats
It'd be great if Dev.to users were able to see stat increases in the overview stats on the dashboard page. Such as:
- Page view / reaction increase over the past 24 hours, 7 days and 30 days
- Comment increase over the past 7 days and 30 days
- Follower increase over the past 24 hours, 7 days and 30 days
- Number of posts published in the past 30 days / current weekly streak (which would partially resolve #9210)
Individual post stats
Additionally, it would be good to see the view, reaction and comment increases for each post again over a 24 hour, 7 days and 30 day period.
I'm aware that we're able to see stats for an individual post using the stats option that has been added next to edit and manage - this is a great addition btw. However, IMO adding it to the main dashboard screen will increase the analytics usability as users will able to see the changes at a glance.
Other
This is sort of an aside (might be another issue entirely). If a view/reaction increase breakdown could be added to the https://dev.to/dashboard/analytics page that would help users understand what posts have been most popular for a given day.
I attempted to implement this feature on my Dev.to analytics dashboard but it became a bit messy when there are lots of posts: https://devto-analytics.wallis.dev/graphs/breakdown


Top comments (2)
On the topic of displaying the user's current weekly streak, I made a little web app to do just that, it wouldn't take any work to turn it into an API that could be used to display the streak on the dashboard.
Hi Christina, thanks for posting this here. I’m excited to see how things progress!
Hopefully the issue above does a good job of summarising my thoughts on the future dashboard. I’d like to see the historical data alongside the totals that are displayed currently.
Looking forward to see what others think!